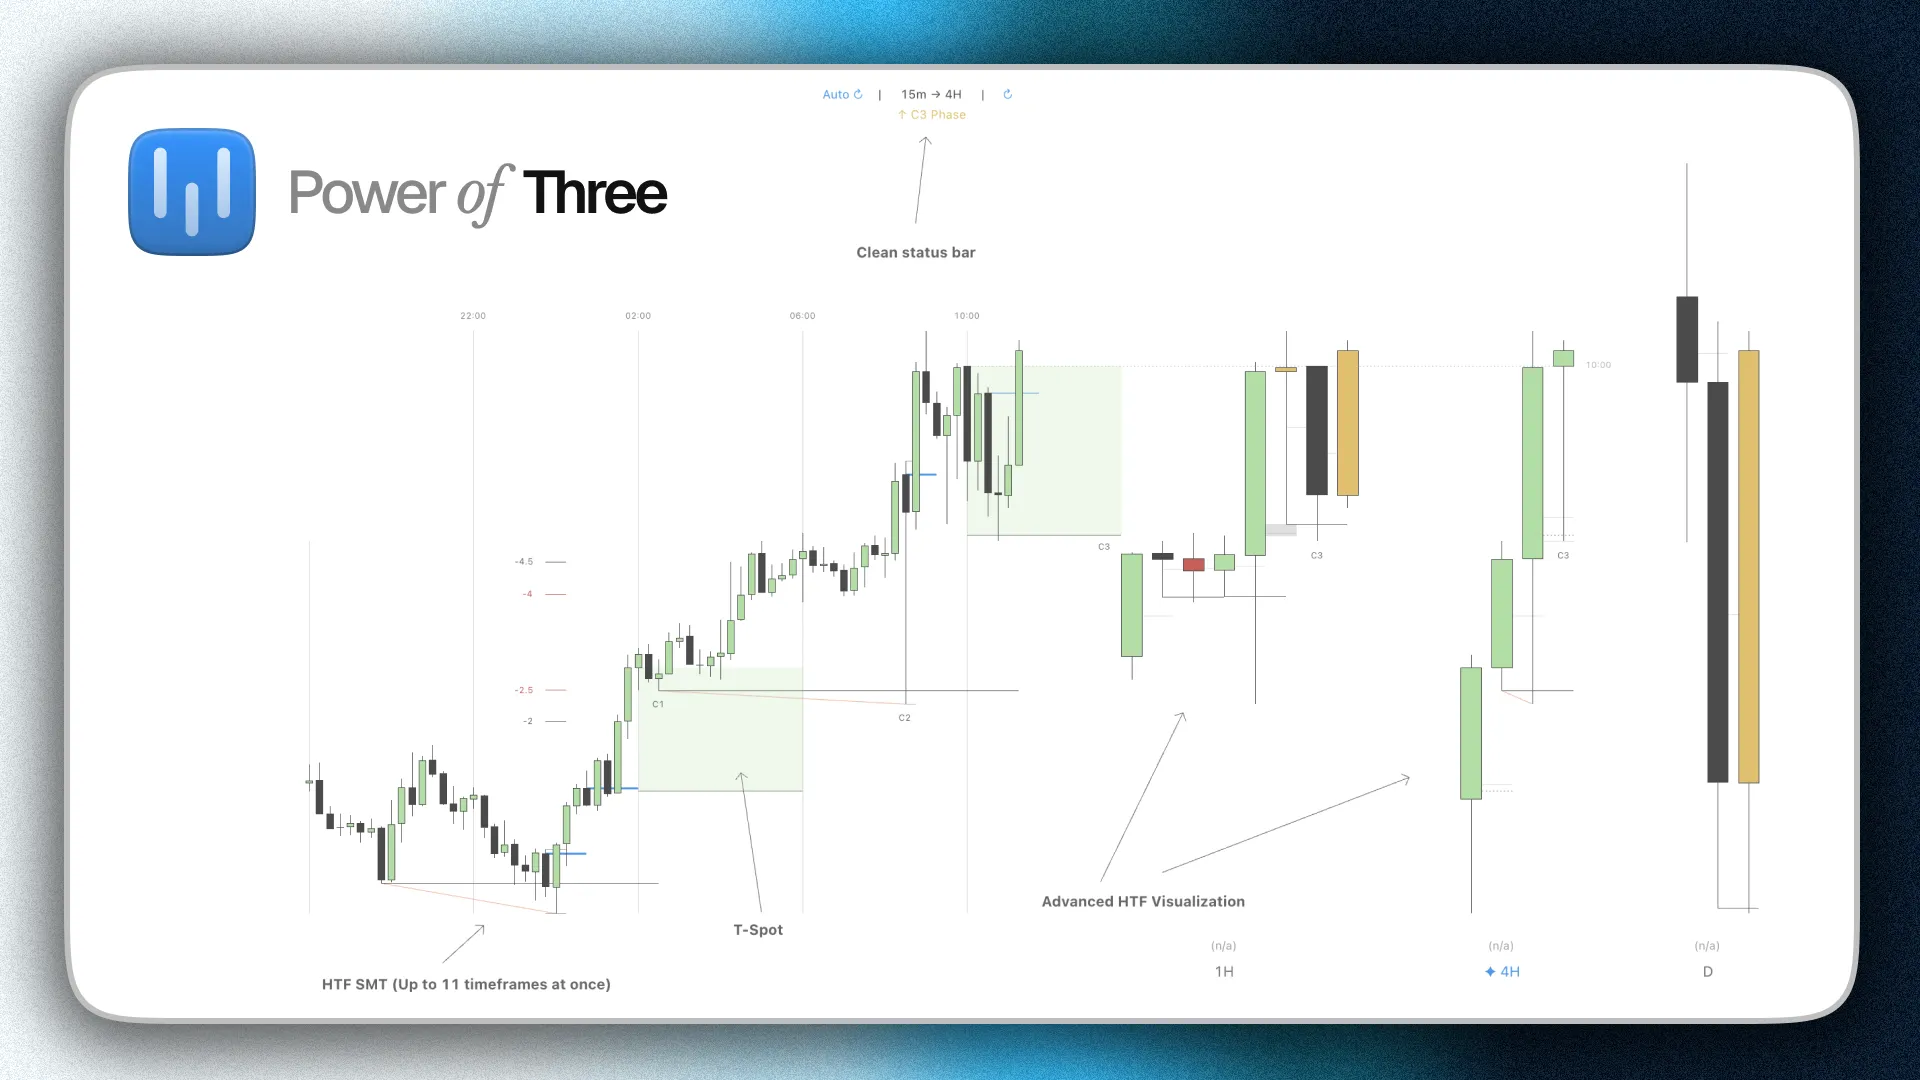
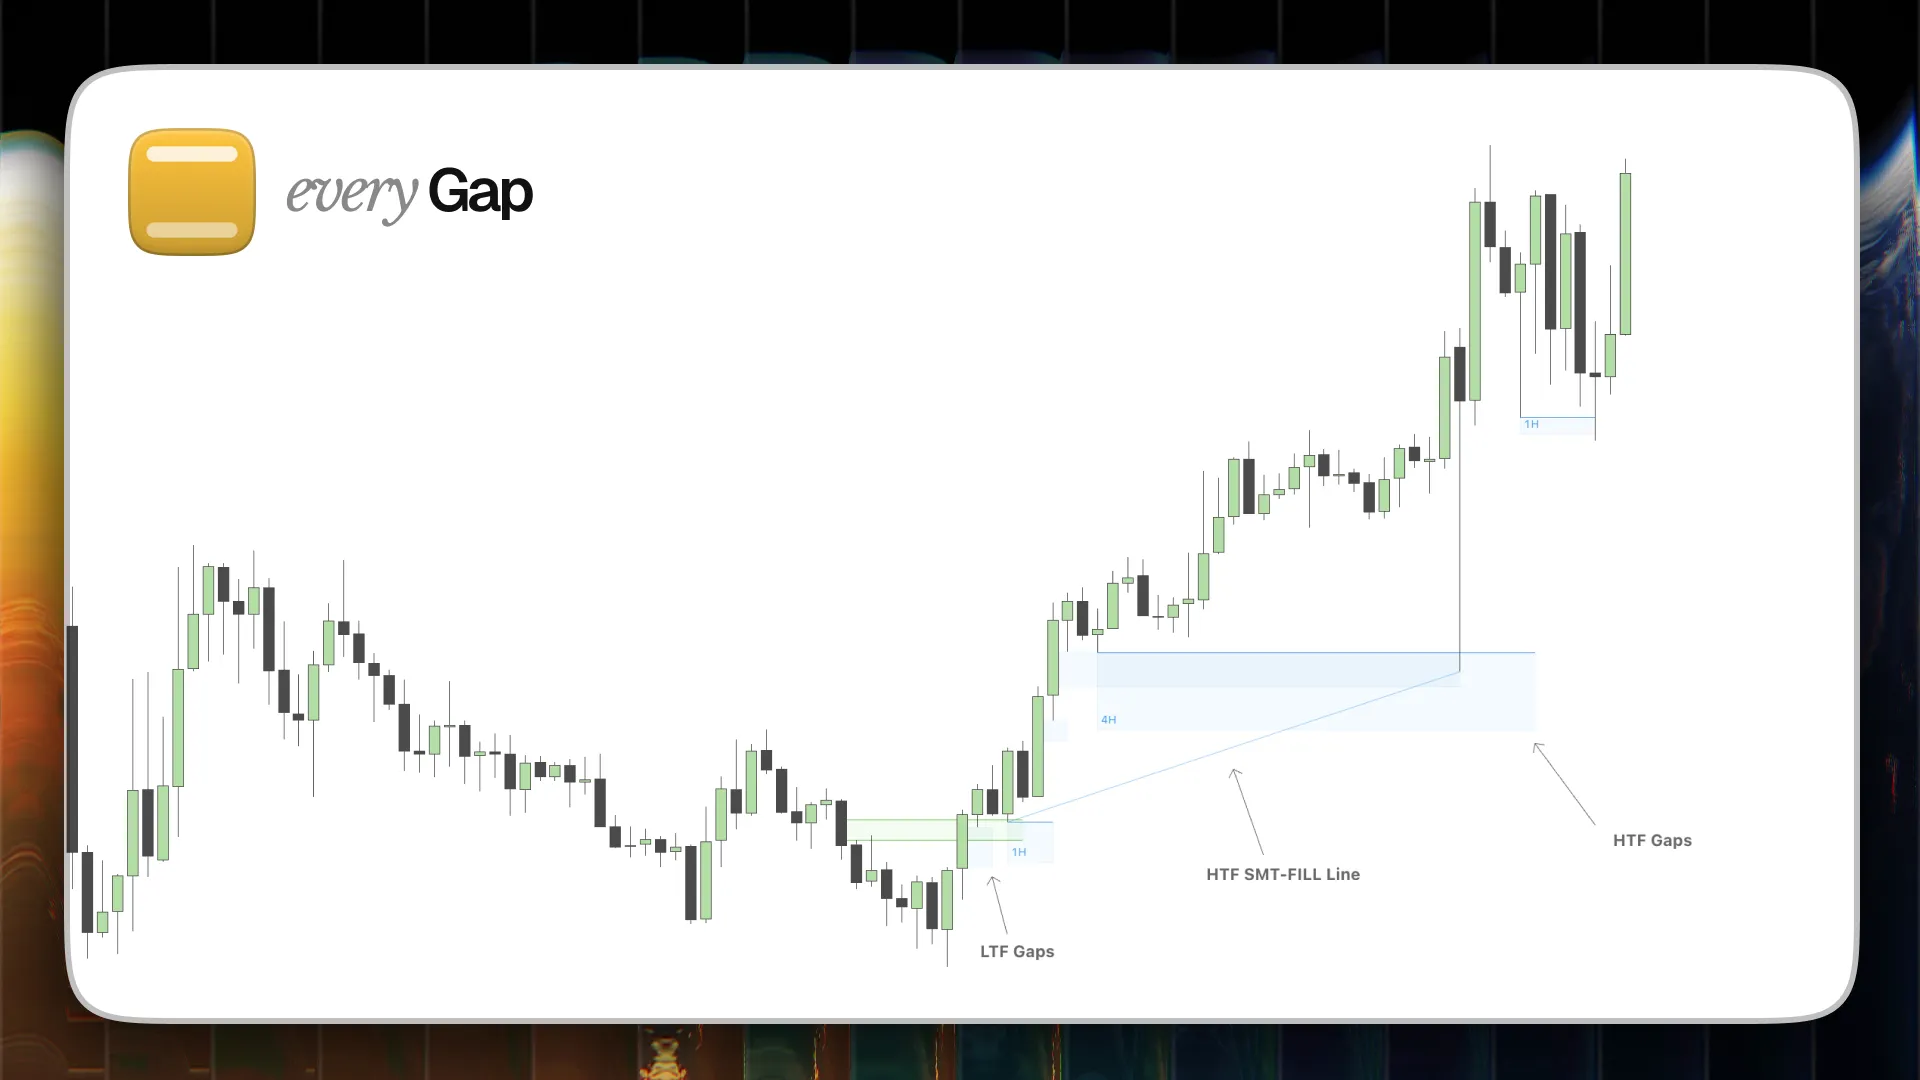
Quarterly Theory
QT maps the market into seven nested time cycles, and it marks every point where the correlated assets disagree inside one of them.
Quarterly Theory
Cross-asset divergence, on seven nested time cycles
01 / The problem
Time cycle work is hand labor, and hand labor is slow
A trader who works with Quarterly Theory marks the quarters by hand. The week splits into days. The day splits into sessions. The session splits into 90-minute blocks, and each block splits again. Each level needs its own marks, and every mark expires.
Then the real work starts. Inside each quarter, the trader compares the high of the chart asset against the high of the correlated asset, and the low against the low. A disagreement inside a quarter is the signal. Agreement is not.
Done by hand, this is one comparison per quarter per cycle per asset pair. On a 1-minute chart, that is hundreds of comparisons per session. No trader does all of them. The trader does a few, picks the cycle that feels relevant, and misses the rest.
It draws only the disagreements. The trader reads lines, not charts.
02 / The time lattice
The Seven-Layer Time Lattice
QT maps the time-based market cycles of Quarterly Theory, and it detects Sequential SMT divergence inside each one. Every layer has its own divergence detection. All seven run at the same time.
- Monthly
- Week-based quarters inside each month.
- Weekly
- Daily quarters inside each trading week.
- Daily
- Session quarters — Asia, London, NY AM, NY PM.
- 90m
- 90-minute cycles in four quarters.
- 30m
- 30-minute cycles.
- Micro
- 64 sessions per day.
- Nano
- 256 sessions per day. High-resolution mode, below 1-minute charts.
03 / SSMT + support
Sequential SMT, and the supporting layers
An SSMT is a disagreement between correlated assets, inside one time cycle. Bullish — your asset makes a lower low, and the correlated asset makes a higher low. Bearish — your asset makes a higher high, and the correlated asset makes a lower high. QT draws a line between the divergent extremes. The line color names the cycle. The label names the cycle, the asset, or both.
- PSP
- A pivot with a divergence on the close. QT can filter these by distance from an existing SSMT line.
- CISD
- A confirmed directional shift after a pivot. It validates the commitment behind a divergence.
- Purge
- A sweep of liquidity through a previous pivot level.